Container Insights metrics in Amazon CloudWatch
In this lab, we will visualize Container Insights metrics using CloudWatch.
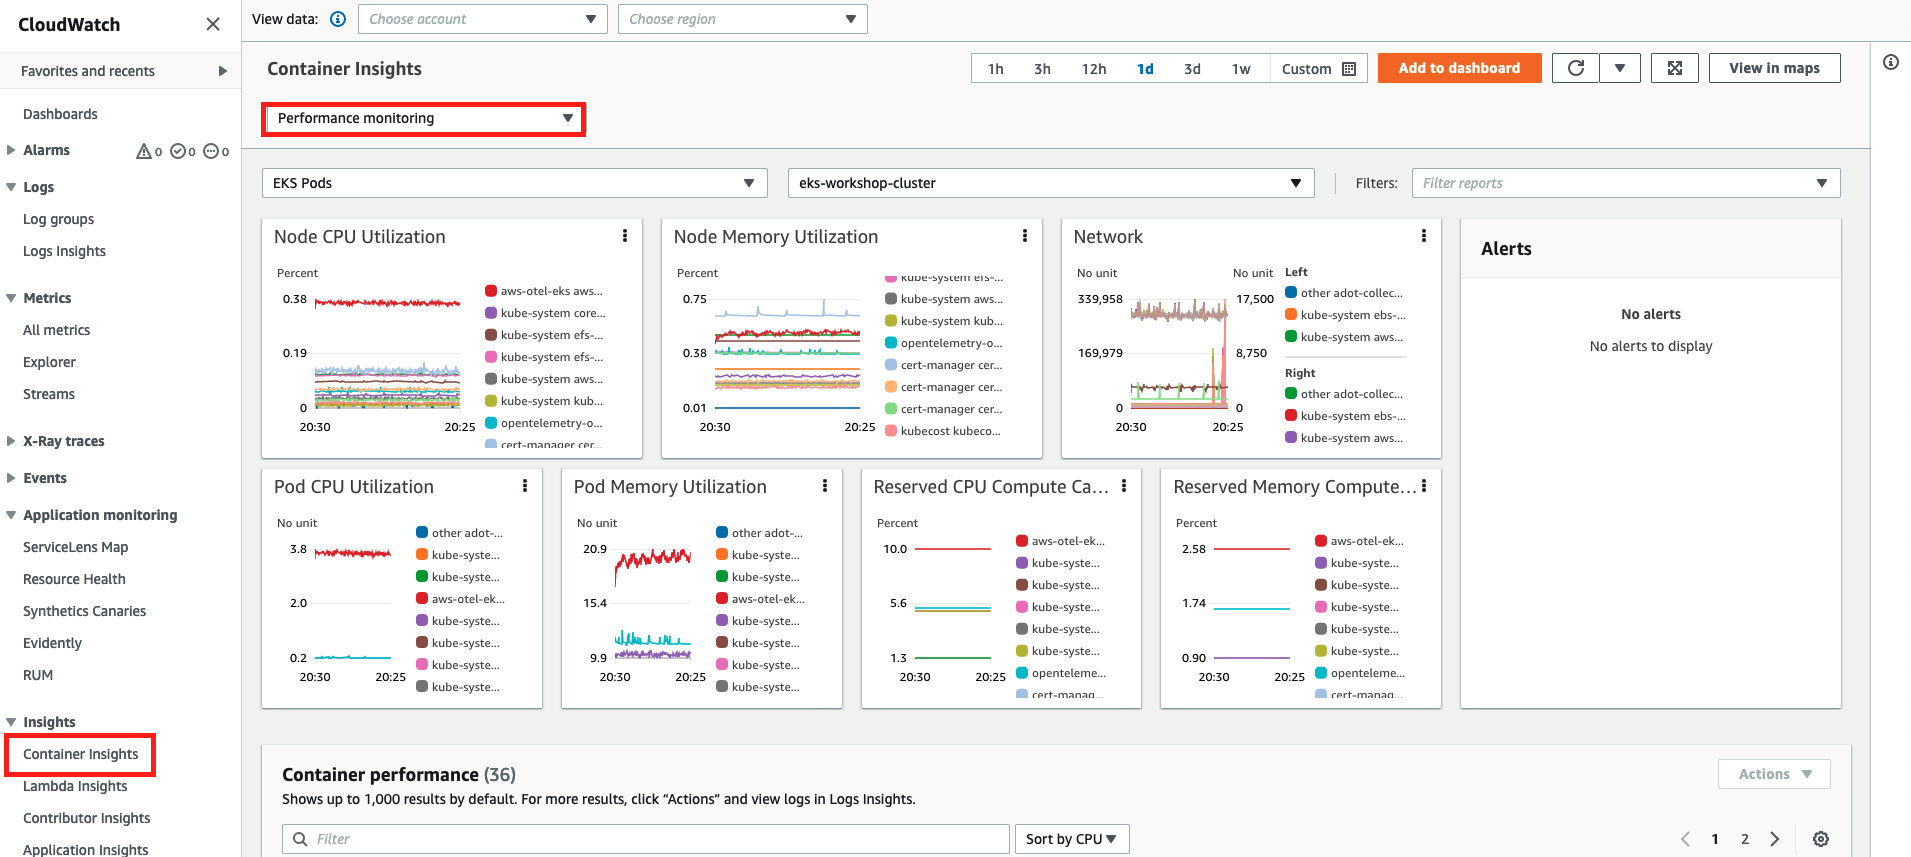
To view the metrics, first open the CloudWatch console and navigate to Container Insights.
Select “Performance Monitoring” from the dropdown menu at the top of the page, and then select the type of resource you want to view. For example, select “EKS Pods” to get basic metrics like CPU, memory, and utilization for the Pods running in our EKS cluster:
You can set up a CloudWatch alarm with any metric that Container Insights collects.