Application Metrics in Amazon CloudWatch
- In this section we’ll look at gaining insight into metrics exposed by our workloads and visualizing those metrics using Amazon CloudWatch Insights Prometheus. Some examples of these metrics could be:
- System metrics such as Java heap metrics or database connection pool status
- Application metrics related to business KPIs
- Let’s look at how to ingest application metrics using AWS Distro for OpenTelemetry and visualize the metrics using Amazon CloudWatch. Each of the components in this workshop have been instrumented to provide Prometheus metrics using libraries relevant to the particular programming language or framework. We can look at an example of these metrics from the orders service like so:
kubectl -n orders exec deployment/orders -- curl http://localhost:8080/actuator/prometheus
[...]
# HELP jdbc_connections_idle Number of established but idle connections.
# TYPE jdbc_connections_idle gauge
jdbc_connections_idle{name="reader",} 10.0
jdbc_connections_idle{name="writer",} 10.0
[...]
# HELP watch_orders_total The number of orders placed
# TYPE watch_orders_total counter
watch_orders_total{productId="510a0d7e-8e83-4193-b483-e27e09ddc34d",} 2.0
watch_orders_total{productId="808a2de1-1aaa-4c25-a9b9-6612e8f29a38",} 1.0
watch_orders_total{productId="*",} 3.0
watch_orders_total{productId="6d62d909-f957-430e-8689-b5129c0bb75e",} 1.0
The output from this command is verbose, for the sake of this lab let us focus on the metric - watch_orders_total:
watch_orders_total- Application metric - How many orders have been placed through the retail store
- You can execute similar requests to other components, for example the checkout service:
$ kubectl -n checkout exec deployment/checkout -- curl http://localhost:8080/metrics
[...]
# HELP nodejs_heap_size_total_bytes Process heap size from Node.js in bytes.
# TYPE nodejs_heap_size_total_bytes gauge
nodejs_heap_size_total_bytes 48668672
[...]
- You’ll recall the collector we’ve already deployed was a DaemonSet, meaning that it runs on every node. This is not desirable when scraping metrics from the Pods in our cluster since we’d end up with duplicate metrics. Now we’ll deploy a second collector running as a Deployment with a single replica.
~/environment/eks-workshop/modules/observability/container-insights/adot-deployment/opentelemetrycollector.yaml
apiVersion: opentelemetry.io/v1beta1
kind: OpenTelemetryCollector
metadata:
  name: adot-container-ci-deploy
  namespace: other
spec:
  image: public.ecr.aws/aws-observability/aws-otel-collector:v0.40.0
  mode: deployment
  serviceAccount: adot-collector-ci
  config:
    receivers:
      prometheus:
        config:
          global:
            scrape_interval: 60s
            scrape_timeout: 15s
            external_labels:
              cluster: ${EKS_CLUSTER_NAME}
              account_id: ${AWS_ACCOUNT_ID}
              region: ${AWS_REGION}
          scrape_configs:
            - job_name: "kubernetes-pods"
              honor_labels: true

              kubernetes_sd_configs:
                - role: pod
              relabel_configs:
                - source_labels:
                    [__meta_kubernetes_pod_annotation_prometheus_io_scrape]
                  action: keep
                  regex: true
                - source_labels:
                    [__meta_kubernetes_pod_annotation_prometheus_io_scrape_slow]
                  action: drop
                  regex: true
                - source_labels:
                    [__meta_kubernetes_pod_annotation_prometheus_io_scheme]
                  action: replace
                  regex: (https?)
                  target_label: __scheme__
                - source_labels:
                    [__meta_kubernetes_pod_annotation_prometheus_io_path]
                  action: replace
                  target_label: __metrics_path__
                  regex: (.+)
                - action: labelmap
                  regex: __meta_kubernetes_pod_annotation_prometheus_io_param_(.+)
                  replacement: __param_$$1
                - action: labelmap
                  regex: __meta_kubernetes_pod_label_(.+)
                - source_labels: [__meta_kubernetes_namespace]
                  action: replace
                  target_label: namespace
                - source_labels: [__meta_kubernetes_pod_name]
                  action: replace
                  target_label: pod
                - source_labels: [__meta_kubernetes_pod_phase]
                  regex: Pending|Succeeded|Failed|Completed
                  action: drop

    processors:
      batch/metrics:
        timeout: 60s

    exporters:
      awsemf/prometheus:
        namespace: ContainerInsights/Prometheus
        log_group_name: "/aws/containerinsights/${EKS_CLUSTER_NAME}/prometheus"
        log_stream_name: "${K8S_POD_NAME}"
        region: ${AWS_REGION}
        resource_to_telemetry_conversion:
          enabled: true
        dimension_rollup_option: NoDimensionRollup
        metric_declarations:
          - dimensions: [[pod, productId]]
            metric_name_selectors:
              - "^watch_orders_total$"

    extensions:
      health_check: {}

    service:
      pipelines:
        metrics:
          receivers: [prometheus]
          processors: [batch/metrics]
          exporters: [awsemf/prometheus]
      extensions: [health_check]

  env:
    - name: K8S_NODE_NAME
      valueFrom:
        fieldRef:
          fieldPath: spec.nodeName
    - name: HOST_IP
      valueFrom:
        fieldRef:
          fieldPath: status.hostIP
    - name: HOST_NAME
      valueFrom:
        fieldRef:
          fieldPath: spec.nodeName
    - name: K8S_NAMESPACE
      valueFrom:
        fieldRef:
          fieldPath: metadata.namespace
    - name: "K8S_POD_NAME"
      valueFrom:
        fieldRef:
          fieldPath: "metadata.name"
- Create the resources we’ve explored above:
$ kubectl kustomize ~/environment/eks-workshop/modules/observability/container-insights/adot-deployment \
  | envsubst | kubectl apply -f- && sleep 5
$ kubectl rollout status -n other deployment/adot-container-ci-deploy-collector --timeout=120s
- We can confirm that our collector is running by inspecting the Pods created by the DaemonSet:
$ kubectl get pod -n other -l app.kubernetes.io/name=adot-container-ci-deploy-collector
NAME                                      READY   STATUS    RESTARTS   AGE
adot-container-ci-deploy-collector-5lp5g  1/1     Running   0          15s
- To support CloudWatch Container Insights Prometheus, we export data with specific dimensions in the form of Embedded Metrics - EMF. CloudWatch EMF publishing converts the data into event update symbols with EMF and then sends it directly to a CloudWatch update group using the PutLogEvents API.
kubectl -n other get opentelemetrycollector adot-container-ci -o jsonpath='{.spec.config}' \
   | yq '.exporters.awsemf/prometheus'
The pipelines are defined in the
opentelemetrycollector.yamlconfiguration file. A pipeline defines the flow of data in the OpenTelemetry collector, and also includes receiving, processing, and exporting metrics. In each stage, there can be multiple components and they can run sequentially (processors) or in parallel (receivers, exporters). Internally, all components communicate using OpenTelemetry’s unified data models so that components from different vendors can coordinate. Receivers collect data from source systems and transform them into internal models. Processors can filter and modify metrics. Exporters transform data into other schemas and send them to target systems. From this configuration, your metrics from the order will be made available under the CloudWatch metrics namespaceContainerInsights/Prometheuswith pod sizes and productIds according to the exporter configuration settings.Now we have the setup complete, we will use the below script to run a load generator which will place orders through the store and generate application metrics:
$ cat <<EOF | kubectl apply -f -
apiVersion: v1
kind: Pod
metadata:
  name: load-generator
  namespace: other
spec:
  containers:
  - name: artillery
    image: artilleryio/artillery:2.0.0-31
    args:
    - "run"
    - "-t"
    - "http://ui.ui.svc"
    - "/scripts/scenario.yml"
    volumeMounts:
    - name: scripts
      mountPath: /scripts
  initContainers:
  - name: setup
    image: public.ecr.aws/aws-containers/retail-store-sample-utils:load-gen.0.4.0
    command:
    - bash
    args:
    - -c
    - "cp /artillery/* /scripts"
    volumeMounts:
    - name: scripts
      mountPath: "/scripts"
  volumes:
  - name: scripts
    emptyDir: {}
EOF
Open the CloudWatch console and navigate to the Dashboards section.
Choose the dashboard Order-Service-Metrics to review the panels within the dashboard:
- We can see how the dashboard was configured to query CloudWatch by hovering over the title of the “Orders by Product” panel and clicking the “Edit” button:
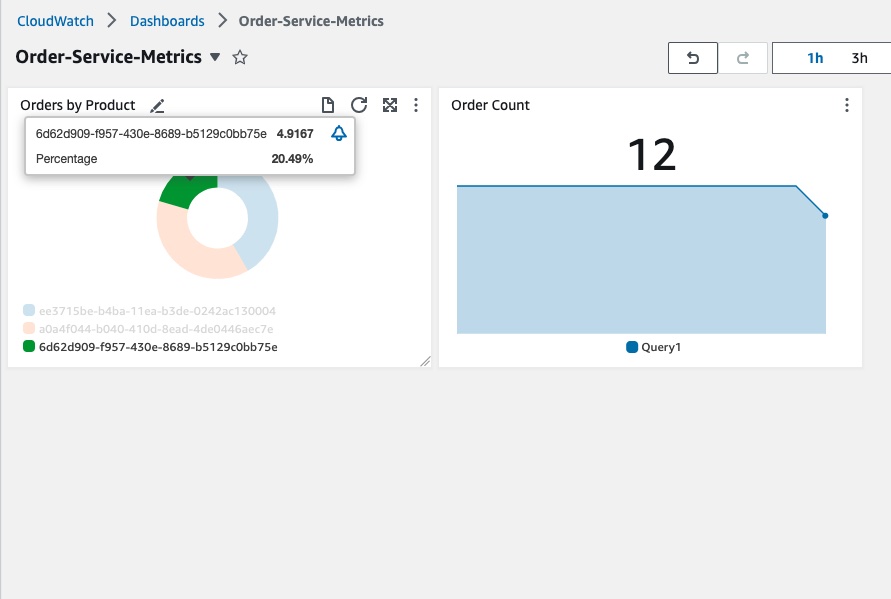
- The query used to create this panel is displayed at the bottom of the page:
SELECT COUNT(watch_orders_total) FROM "ContainerInsights/Prometheus" WHERE productId != '*' GROUP BY productId
Which is doing the following:
- Query for the metric
watch_orders_total - Ignore metrics with a
productIdvalue of* - Sum these metrics and group them by
productId
- Once you’re satisfied with observing the metrics, you can stop the load generator using the below command.
$ kubectl delete pod load-generator -n other